Loading and plotting airfoils
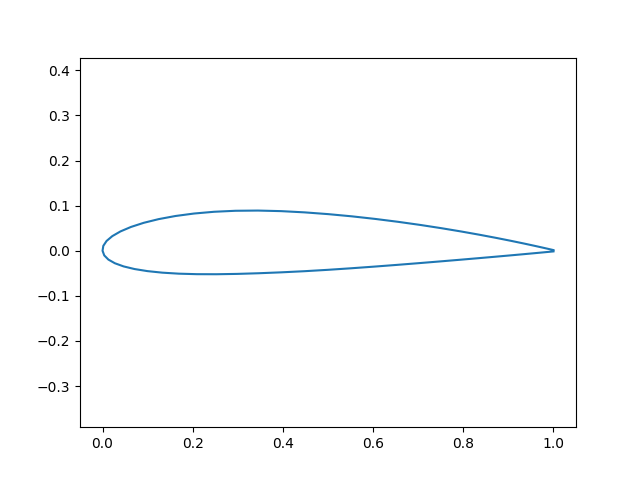
This example loads airfoil coordinates from a text file and plots them.
Specifications
- The airfoil is NACA 2414
Code
# -*- coding: utf-8 -*-
"""Example 1: Load and plot airfoil coordinates
"""
import os

import matplotlib.pyplot as plt

from mypack.utils.io import read_selig
from mypack.utils.plotting import plot_airfoil


def example_1():
    """Run example 1"""
    # script inputs
    mod_path = os.path.dirname(os.path.abspath(__file__))  # current module
    air_path = os.path.join(mod_path, '..',
                            'tests', 'test_utils', 'files', 'demo_selig.dat')

    # load coordinates from a a selig-style airfoil file
    air_df = read_selig(air_path)

    # plot the airfoil
    plot_airfoil(air_df)

    # save the png for the documentation
    fig = plt.gcf()
    save_name = os.path.basename(__file__).replace('.py', '.png')  # file name
    save_path = os.path.join(mod_path, save_name)
    fig.savefig(save_path)


if __name__ == '__main__':  # call function when run as script
    example_1()